Logging
The Logging page is the central place for runtime diagnostics and troubleshooting in YouTube Music Streamer.
It contains three tabs inside the application:
- Global controls the application's log level and provides quick diagnostic actions.
- Diagnostics shows subsystem health and recent structured diagnostic events.
- Logs shows the last 100 lines from the current log file.
The sections below follow the same structure while remaining visible in the page table of contents.
Log settings
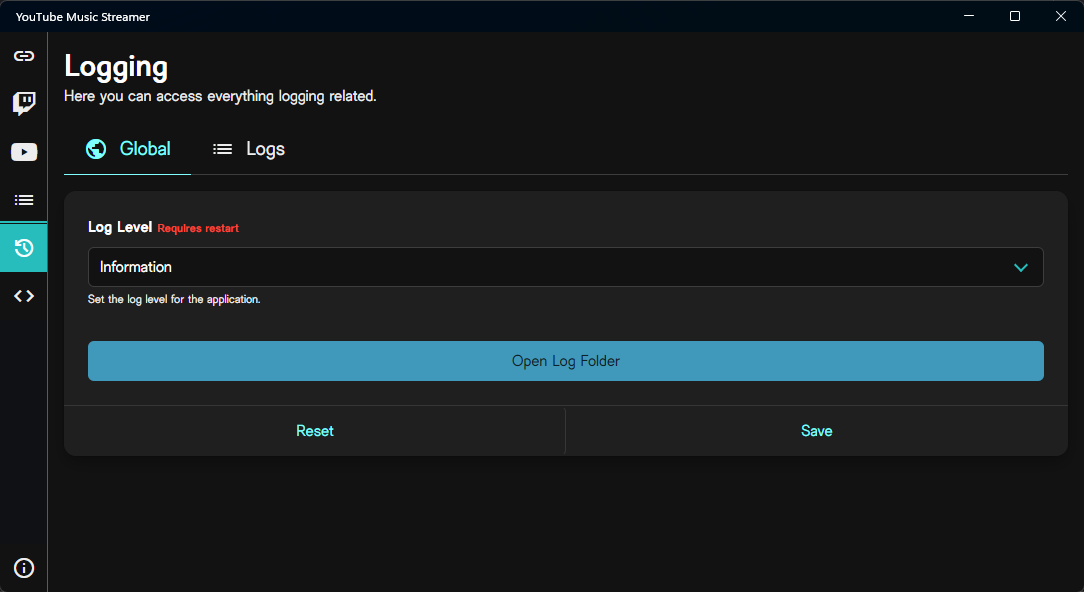
Log Level
The log level controls how much information the application writes to its log file.
Changes are applied when you select Save.
The available levels are:
| Level | Meaning |
|---|---|
| Trace | Very detailed logging for deep troubleshooting. |
| Debug | Detailed diagnostic logging useful during development or issue analysis. |
| Information | Normal operational logging for general troubleshooting. |
| Warning | Only warnings and more severe events. |
| Error | Only errors and critical failures. |
| Critical | Only the most severe failures. |
| None | Disables log output. |
For normal use, Information is usually the most practical choice.
Use Debug or Trace only when you need deeper troubleshooting detail, because those levels can produce much more output.
Open Log Folder
Select Open Log Folder to open the folder where YouTube Music Streamer stores its log files.
This is useful when you want to:
- inspect older log files manually;
- attach logs to a bug report;
- keep a copy before reproducing an issue.
Copy Diagnostics Summary
Select Copy Diagnostics Summary to copy a plain-text diagnostic report to your clipboard.
This summary is useful when reporting problems, because it includes:
- the time the summary was generated;
- the current log level;
- recent diagnostics;
- exception details when available.
It is a good lightweight alternative when you do not want to send the full raw log file immediately.
Saving and resetting
Select Save to persist the selected log level.
Select Reset to restore the most recently saved value.
Current health
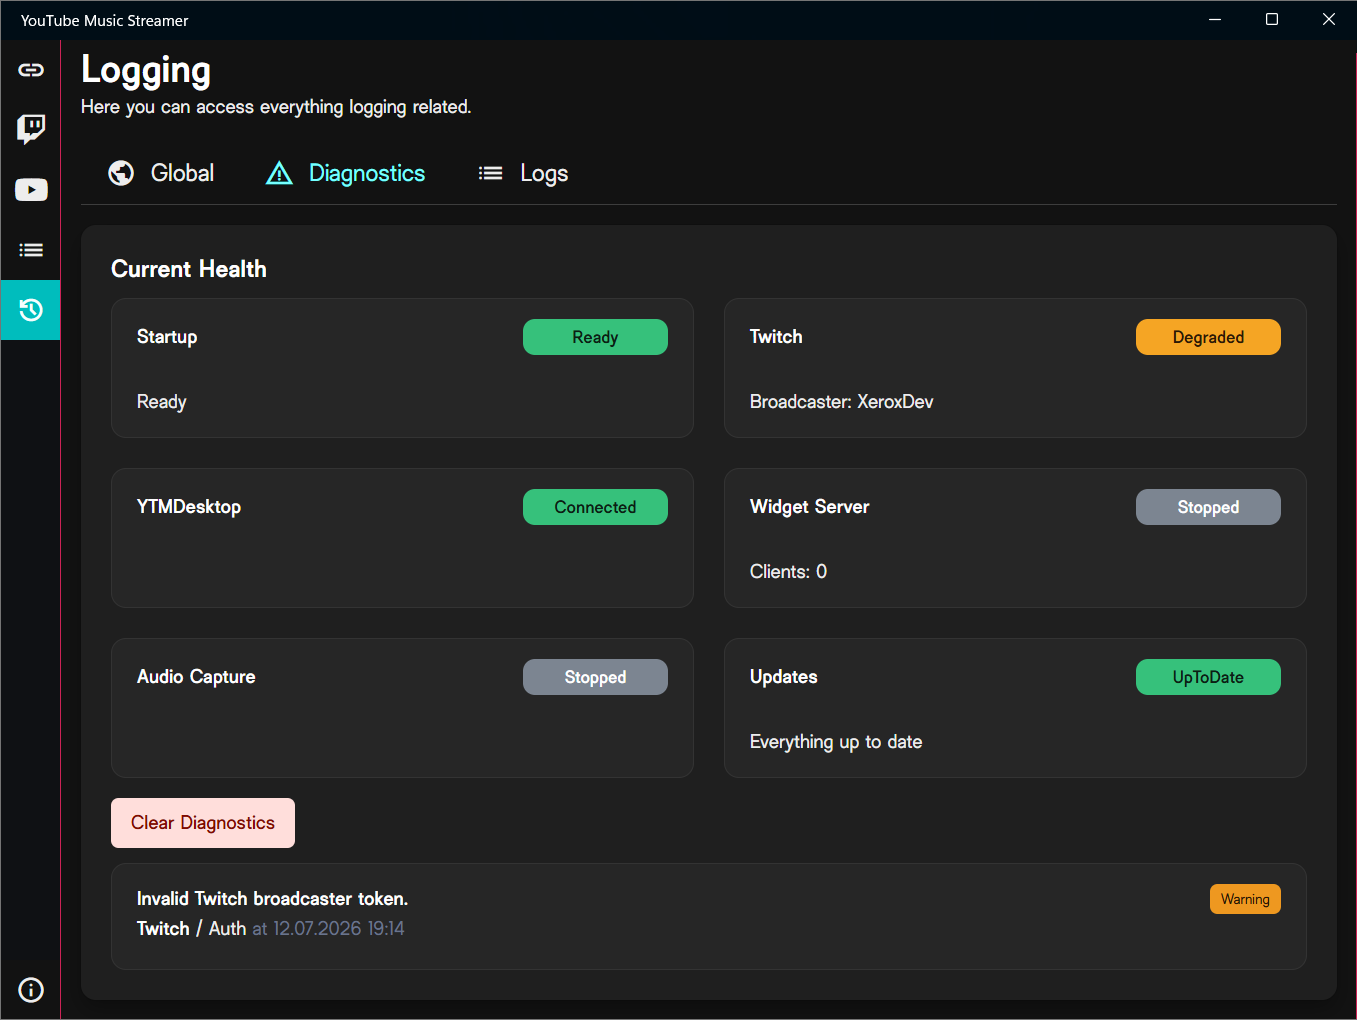
The Diagnostics tab starts with a Current Health overview.
It summarizes the current runtime state of important application subsystems:
- Startup
- Twitch
- YTMDesktop
- Widget Server
- Audio Capture
- Updates
Each card shows:
- the subsystem name;
- a status badge;
- a short detail line when available.
Examples of detail lines include:
- the connected Twitch broadcaster or bot;
- the number of connected widget clients;
- a current error message;
- the update status text.
Health statuses
The exact status values depend on the subsystem.
Common examples include:
- Ready
- Connected
- Degraded
- Stopped
- UpToDate
- Error
In practice:
- green-style statuses usually indicate healthy operation;
- yellow/orange-style statuses usually indicate a degraded or warning condition;
- grey/muted-style statuses usually indicate a stopped or inactive component;
- red-style statuses indicate an error condition.
Use this section first when you want a quick overview of what is currently broken or unavailable.
Recorded diagnostics
Below the health overview, the Diagnostics tab shows recent structured diagnostic entries.
Each entry may include:
- a short summary;
- severity;
- subsystem;
- category;
- local timestamp;
- an optional detail message.
This list is intended to be easier to read than the raw log file.
Severity
Diagnostic severities include:
- Info
- Warning
- Error
Use them as a quick indicator of urgency.
Technical details
Some diagnostics include expandable technical details, such as exception information.
When available, select Show technical details to expand the full technical error text.
This is especially useful when:
- a connection attempt fails;
- a startup operation throws an exception;
- a service enters an unexpected error state.
Select the same button again to hide the details.
Clear Diagnostics
Select Clear Diagnostics to remove the currently recorded diagnostics from the in-app diagnostics list.
This can be useful when:
- you want to reproduce an issue from a clean state;
- you only want to observe newly generated diagnostics;
- you want to verify whether a problem still occurs after changing settings.
Note
Clearing diagnostics affects the in-app diagnostics list.
It does not delete the raw log files already written to disk.
Raw logs
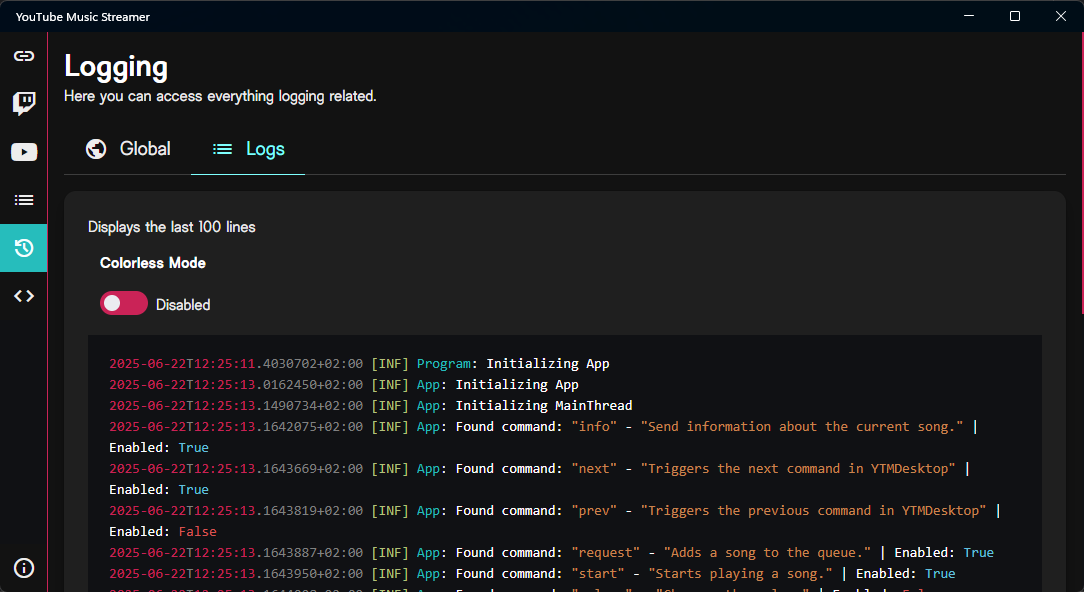
The Logs tab displays the last 100 lines from the current log file.
This view is helpful when you want to inspect the latest application activity without opening the log folder manually.
The view focuses on the most recent lines so it remains manageable during longer sessions.
Live log view
The log view updates as the current log file changes.
This makes it useful for observing what happens while you:
- connect Twitch accounts;
- reconnect to YTMDesktop;
- configure the widget server;
- test commands or rewards;
- reproduce a bug.
Colorless Mode
Colorless Mode controls whether the log viewer uses visual syntax highlighting.
When disabled:
- timestamps, levels, and message parts are colorized;
- important values are easier to spot quickly.
When enabled:
- log lines are shown without the extra color highlighting;
- the output may be easier to copy or read if you prefer plain text presentation.
This setting only affects the in-app log viewer.
It does not rewrite or change the actual log file on disk.
When to use diagnostics vs. logs
Use Diagnostics when you want:
- a quick overview of application health;
- structured issue summaries;
- a smaller and easier-to-read issue list;
- expandable exception details.
Use Logs when you want:
- the exact recent raw log output;
- more chronological context;
- low-level details that may not appear as structured diagnostics.
In practice, the best troubleshooting flow is often:
- check Current Health;
- review the Diagnostics entries;
- inspect the Logs tab if you need more detail;
- copy the diagnostics summary or open the log folder when reporting the issue.
Preparing a support report
When you want to report a problem to the project maintainer or include diagnostics in an issue:
- open the Logging page;
- check the Diagnostics tab for the current health state;
- reproduce the problem if needed;
- copy the text using Copy Diagnostics Summary;
- if additional detail is needed, open the log folder and attach the relevant log file.
If the issue is tied to a specific action, it can help to reproduce it immediately before copying the summary so the newest diagnostics are included.